Showing posts with label R. Show all posts

Wednesday, 6 February 2013

Handling R packages Feb 2013 issue Linux Journal

The kind folks at http://www.linuxjournal.com/ have provided me an 2013 Feb issue. Can't tell you how much of Linux I have picked up from there with its easy prose and graphical howtos. In the Feb 2013 issue, they have focused on the theme sys admin. Definitely useful things inside for the starting bioinformatician who wishes to dabble with working directly off a *nix machine :)

Other topics in this issue includes


In the February 2013 issue:
  • Manage Your Virtual Deployment with ConVirt
  • Use Fabric for Sysadmin Tasks on Remote Machines
  • Spin up Linux VMs on Azure
  • Make Your Android Device Play with Your Linux Box
  • Create a Colocated Server with Raspberry Pi


You can check out a preview of the contents here

February 2013 Issue of Linux Journal: System Administration

Tuesday, 4 September 2012

R one-liners : do you have any to contribute?

NOT sure if installing packages to use one-liners count but heck .. anything to improve productivity eh?

excerpted from Jeffrey's blog http://jeffreybreen.wordpress.com/2011/07/21/one-liners-twitter/


One-liners which make me love R: twitteR’s searchTwitter() #rstats


R reminds me a lot of English. It’s easy to get started, but very difficult to master. So for all those times I’ve spent… well, forever… trying to figure out the “R way” of doing something, I’m glad to share these quick wins.
My recent R tutorial on mining Twitter for consumer sentiment wouldn’t have been possible without Jeff Gentry’s amazing twitteR package (available on CRAN). It does so much of the behind-the-scenes heavy lifting to access Twitter’s REST APIs, that one line of code is all you need to perform a search and retrieve the (even paginated) results:
library(twitteR)
tweets = searchTwitter("#rstats", n=1500)
You can search for anything, of course, “#rstats” is just an example. (And if you’re really into that hashtag, the twitteR package even provides an Rtweets() function which hardcodes that search string for you.) The n=1500 specifies the maximum number of tweets supported by the Search API, though you may retrieve fewer as Twitter’s search indices contain only a couple of days’ tweets.


Tuesday, 21 August 2012

Book: Applied Statistic Genetics with R with data & code!

Check this out! http://people.umass.edu/foulkes/asg/examples.html
This book is intended to provide fundamental statistical concepts and R tools relevant to the analysis of genetic data arising from population-based association studies.  The statistical methods described are broadly relevant to the field of statistical genetics and include a large array of tools for a wide variety of medical and public health applications.  Data analytic methods include approaches to handling multiplicity, ambiguity in haplotypic phase and underlying gene-gene and gene-environment interactions.  Several publicly available data sets are used for illustration
  •           Chapter 1
                #  1.1:  Identifying the minor allele and its frequency

                Chapter 2
                
  •             #  2.1: Chi-squared test for association
                
    #  2.2: Fisher's exact test for association
                
    #  2.3: Chochran-Armitage (C-A) trend test for association
                #  2.4: Two-sample tests for association for a quantitative trait

                #  2.5: M-sample tests of association for a quantitative trait
                #  2.6: Linear Regression
  •             Chapter 3
  •             #  3.1: Measuring LD using D-prime
                #  3.2: Measuring LD for a group of SNPs
  •             #  3.3: Measuring LD based on r^2 and the \chi^2-statistic
                #  3.4: Determining average LD across multiple SNPs
  •             #  3.5: Population substructure and LD
                #  3.6: Testing for HWE using Pearsons \chi^2-test
  •             #  3.7:  Testing for HWE using Fishers exact test
                #  3.8:  HWE and geographic origin
  •             #  3.9: Generating a similarity matrix
                #  3.10: Multidimensional scaling (MDS) for identifying population substructure
  •             #  3.11: Principal components analysis (PCA) for identifying population substructure 
  •             Chapter 4
  •             #  4.1: Bonferroni adjustment
                #  4.2: Tukeys single-step method
  •             #  4.3: Banjamini and Hochberg (B-H) adjustment            #  4.4: Benjamini and Yekutieli (B-Y) adjustment
  •             #  4.5: Calculation of the q-value
  •             #  4.6: Free step down resampling adjustment
  •             #  4.7: Null unrestricted bootstrap approach
  •             Chapter 5
                #  5.1: EM approach to haplotype frequency estimation
  •             #  5.2Calculating posterior haplotype probabilities 
                #  5.3:
     Testing hypotheses about haplotype frequencies within the EM framework
  •             #  5.4: Application of haplotype trend regression (HTR)
                #  5.5: Multiple imputation for haplotype effect estimation and testing
  •             #  5.6: EM for estimation and testing of haplotype-trait association
  •             Chapter 6
                #  6.2: Creating a classification tree
  •             #  6.3: Generating a regression tree
                #  6.4: Categorical and ordinal predictors in a tree
                #  6.5: Cost-complexity pruning
  •             Chapter 7
                #  7.1: An application of random forests
  •             #  7.2: RF with missing SNP data - single imputation
                #  7.3: RF with missing SNP data - multiple imputation
  •             #  7.4: MIRF
  •             #  7.5: Application of logic regression
  •             #  7.6: Monte Carol logic regression
  •             #  7.7: An application of MARS

Getting Started with R and Hadoop

Getting Started with R and Hadoop: (This article was first published on Revolutions, and kindly contr... 


For newcomers to map-reduce programming with R and Hadoop, Jeffrey's presentation includes a step-by-step example of computing flight times from air traffic data. The last few slides some advanced features: how to work directly with files in HDFS from R with the rhdfs package; and how to simulate a Hadoop cluster on the local machine (useful for development, testing and learning RHadoop). Jeffrey also mentions that the RHadoop tutorial is a good resource for new users.
You can find Jeffrey's slides embedded below, and a video of the presentation is also available. You might also want to check out Jeffrey's older presentation Big Data Step-by-Step for tips on setting up a compute environment with Hadoop and R.


Wednesday, 25 July 2012

howto SKAT R library

The R package is simple to install though you will need a recent version of R (compile as local user if you have no admin rights)

download from 

~/Downloads$ R CMD INSTALL SKAT_0.76.tgz 
* installing to library '/Library/Frameworks/R.framework/Versions/2.14/Resources/library'
* installing *binary* package 'SKAT' ...

* DONE (SKAT) 

Wednesday, 21 December 2011

Hilbertvis installation in R (no admin rights required!)


Playing around with
HilbertVis: Visualization of genomic data with the Hilbert curve

HilbertVis - Bioconductor www.bioconductor.org/packages/release/bioc/html/HilbertVis.html


Trying out an idea to use Hilbert Curves as a method to visually inspect WGS mapped bams for regions of low coverage or unequal coverage across samples.

It has a standalone GUI version that requires gtk+ packages that may not be avail on all systems.

The cool thing is that it can be installed locally within your user directory with a few simple commands

R is a collaborative project with many contributors.
Type 'contributors()' for more information and
'citation()' on how to cite R or R packages in publications.
Type 'demo()' for some demos, 'help()' for on-line help, or
'help.start()' for an HTML browser interface to help.
Type 'q()' to quit R.
>
> source("http://bioconductor.org/biocLite.R")
> biocLite("HilbertVis")

Using R version 2.10.0, biocinstall version 2.5.11.
Installing Bioconductor version 2.5 packages:
[1] "HilbertVis"
Please wait...
Warning in install.packages(pkgs = pkgs, repos = repos, ...) :
  argument 'lib' is missing: using '/usr/lib64/R/library'
Warning in install.packages(pkgs = pkgs, repos = repos, ...) :
  'lib = "/usr/lib64/R/library"' is not writable
Would you like to create a personal library
'~/R/x86_64-redhat-linux-gnu-library/2.10'
to install packages into?  (y/n)
y

Tuesday, 22 March 2011

Cheat Sheets Galore-bioinformatics, biology, linux,perl, python, R

started with Keith's post here
http://omicsomics.blogspot.com/2011/03/whats-on-your-cheat-sheet.html

and a thread at
http://biostar.stackexchange.com/questions/6683/bioinformatics-cheat-sheet


I have soooo many of them! *this is going to be a long post
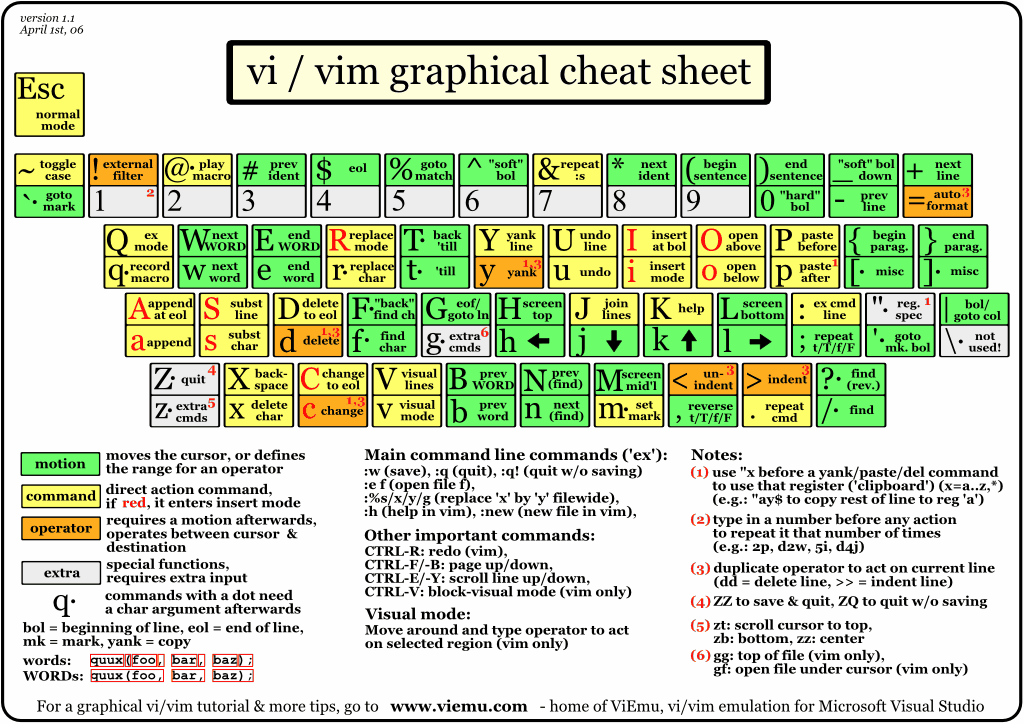
Vim
http://www.viemu.com/vi-vim-cheat-sheet.gif
Python
http://www.addedbytes.com/cheat-sheets/python-cheat-sheet/
R (pdf)
http://cran.r-project.org/doc/contrib/Short-refcard.pdf
Perl 
Hmmmm where did that go to?
AWK one liners
Sed examples
Linux common tasks


I have these too 
  • IUPAC ambiguity codes for nucleotides:
  • Amino acid single letter codes.


Saturday, 12 March 2011

RStudio IDE for R ... looks promising!

RStudio, released yesterday, is a new open-source IDE for R. It’s getting a lot of attention at R-bloggers and it’s easy to see why: this is open-source software development done right.
from 

What You’re Doing Is Rather Desperate

Notes from the life of a bioinformatics researcher


A pipeline for RNA-seq data processing and quality assessment from Bioinformatics - current issue


A pipeline for RNA-seq data processing and quality assessment

Summary: We present an R based pipeline, ArrayExpressHTS, for pre-processing, expression estimation and data quality assessment of high-throughput sequencing transcriptional profiling (RNA-seq) datasets. The pipeline starts from raw sequence files and produces standard Bioconductor R objects containing gene or transcript measurements for downstream analysis along with web reports for data quality assessment. It may be run locally on a user's own computer or remotely on a distributed R-cloud farm at the European Bioinformatics Institute. It can be used to analyse user's own datasets or public RNA-seq datasets from the ArrayExpress Archive.
Availability: The R package is available at www.ebi.ac.uk/tools/rcloud with online documentation at www.ebi.ac.uk/Tools/rwiki/, also available as supplementary material.

Saturday, 29 January 2011

VennDiagram: a package for the generation of highly-customizable Venn and Euler diagrams in R

Visualization of orthogonal (disjoint) or overlapping datasets is a common task in bioinformatics. Few tools exist to automate the generation of extensively-customizable, high-resolution Venn and Euler diagrams in the R statistical environment. To fill this gap we introduce VennDiagram, an R package that enables the automated generation of highly-customizable, high-resolution Venn diagrams with up to four sets and Euler diagrams with up to three sets.

Wednesday, 26 May 2010

Installing R on CentOS 5.4 64 bit

create R.repo file in /etc/yum.repos.d/

[R-project]
name=R project for Statistical Computing repository
baseurl=http://rm.mirror.garr.it/mirrors/CRAN/bin/linux/redhat/el5/x86_64/
failovermethod=priority
enabled=1
gpgcheck=0
priority=15

yum install R

Propograte rpms across cluster..
/var/cache/yum/R-project/packages/R-2.10.0-2.el5.x86_64.rpm

Datanami, Woe be me